
Today, we are going to dive into relational database performance using PostgreSQL. PostgreSQL is a powerful, open-source relational database known for its reliability, extensibility, and heavy compliance with the SQL standard. We will explore why indexing your database is important for its performance and the tools that can be used to improve the indexing of an existing database.
What is database indexing?
For each record in the table of a relational database, a new row is created. As the number of rows increases, it becomes more and more complex to search for a particular row quickly and indexing the table is required.
An index is a data structure that improves the speed of data retrieval operations on a table. You can see it as an index at the end of a large book mentioning on which page the different terms and concepts that were discussed. In a book index, you would order your different terms alphabetically for readers to quickly find the relevant page. Similarly, a database index orders data (in most cases using a balanced tree) to allow fast search in logarithmic time.
When a new table is created in a database, adding some indexes to tables in order to match the way data is queried is a best practice usually followed. But as projects evolve, it is possible that some indexes are not updated or added when queries change. We will walk through an example to identify whether all the useful indexes are in place on an existing project.
Testing the Spring Pet Clinic project
The Spring Pet Clinic is a well-known test application provided by Spring which simulates a veterinarian clinic. The application manages lists of vets, pets, pet owners, and visits to the clinic. We will use this application as the basis for our test and use the Spring Pet Clinic Jmeter test to populate the database.

Test scenario
500 threads in parallel are going to run 10 times the following workflow
– List vets
– List owners
– Add a new pet to an existing owner (3 different owners max, 3 different pets max)
– Add a new visit to an existing pet
We are not going to evaluate the quality of this performance test and if it tests correctly the application. The purpose of this test plan for this article is to fill in the database with 5000 new visits and generate some traffic on the database.
The Spring Pet Clinic application has its tables correctly indexed, so I am going to drop an index and see if we can quickly identify the missing index.
After executing the workflow 5,000 times, Jmeter returns the response times for each query, but these do not provide meaningful insight on their own:

Are they fast or slow? Without any other data to compare with, having raw response times is useless.
PostgreSQL statistics
All decent database vendors provide various tools to gather metrics and statistics and help us understand what is happening in our database. Today we are going to use two of them:
– pg_stat_user_tables: provides statistics about a table
– pg_stat_statements: tracks execution statistics about queries
We will run two simple queries to try to identify queries that could benefit from an improved indexing:
1/ A query that returns the number of sequential scans and index scans for each table. An index scan means that the database engine used an index to run the query and find the rows, while a sequential scan just went through a full database scan without using any index. It is worth mentioning that even if there is an index on a table, the engine may use a sequential scan as they are sometimes faster than an index scan. That being said, if we see significantly more sequential scans than index scans, it may indicate that an index is missing.
2/ A query that returns the execution time of each query on a given table to get more insights on the queries so that we can identify the index that may be required.
Looking for sequential scans
The following query will list the different tables, the number of scans of each type and the number of rows read by sequential scans. As mentioned before, the engine usually chooses to use sequential scans when the number of rows in a table is low, these queries typically do not impact performance.
It is worth mentioning that I cleared the statistics beforehand to ensure results aren’t skewed by outdated data.
SQL query
select
schemaname,
relname as table_name,
idx_scan as index_scans,
seq_scan as sequential_scans,
seq_tup_read as nb_rows_read_sequential,
seq_tup_read / seq_scan as avg_nb_rows_by_scan
from pg_stat_user_tables
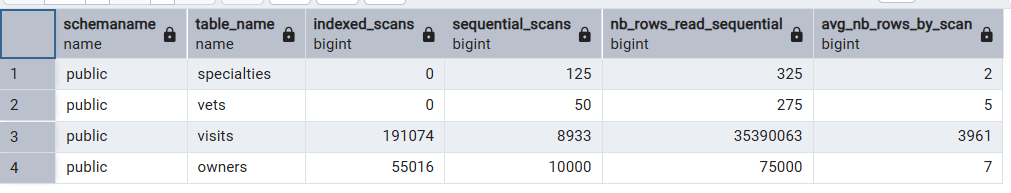
where seq_scan > 0Results:

We can see that the owners table has 10,000 sequential scans but they are only reading 7 rows each, on average, so we can expect them to be fast.
On the other hand we have way more sequential scans than index scans on the visits table and they are going through a lot of data. So this table may need more indexing.
Looking for slow queries
Now let’s use the pg_stat_statements table to get more insights about slow queries.
It is important to note that the pg_stat_statements must be enabled in the postgresql.conf. It adds a 1 – 2% CPU and memory overhead to collect statistics. In most cases, it is still recommended to enable it: slow queries and poorly optimized configuration cost much more than the slight performance overhead needed to get the statistics.
The following query returns the number of calls, total and mean execution time of every query that accesses the visits table
SQL query
SELECT
query,
calls,
total_exec_time,
mean_exec_time,
rows
FROM pg_stat_statements
WHERE query LIKE '%visits%'
order by calls desc
Results:

The select statement is called 286,074 times, which matches the number of sequential scans in the previous query. The total time spent running this query is 127 seconds. Is it slow or fast? Again there is no data for comparison yet, what is important is that the data is queried 286,000 times by pet_id, so we want to create an index on the pet_id column.
We have successfully identified a query which is running without a proper index, by running only two SQL queries. If you have 10 minutes of spare time, I highly recommend to run these queries.
Last thing we can do is add the missing index and run the same test scenario:
After adding the index, only 5% of the queries on the visits table performed a sequential scan. And if we look at the execution time of the query:

The mean execution time reduced by 30%, reducing request latency and saving precious database resources. And keep in mind that we are talking about a table with less than 5,000 rows. The benefits are exponential when the number of rows reaches the scale typically seen in a production environment.
That concludes this article. There is much more to explore about database indexes and many more ways to use database statistics to tune the database performance. We will cover more in future articles but in the meantime the PostgreSQL documentation is a great place to start.

Leave a comment