
In this series of posts, I want to share my experience with real performance issues that I have seen happening in production. This article will be in two parts showing two different side effects of trusting default configuration.
Spring Web thread pool configuration
When you start a Spring Boot application using Spring Web to serve some HTTP APIs, Spring bundles and starts a Tomcat container. To handle the incoming traffic, Tomcat uses a thread pool. A thread pool is a collection of reusable threads that are used to serve each request. Reusing a thread instead of starting a thread reduces the latency to process the request. When all the threads in the pool are already used and a new request arrives on the server, the request waits in a queue until a thread is released.
The default values of the thread pool for Tomcat are:
- Maximum number of threads: 200
- Number of “spare” threads: 10
- Maximum number of queued requests: 100
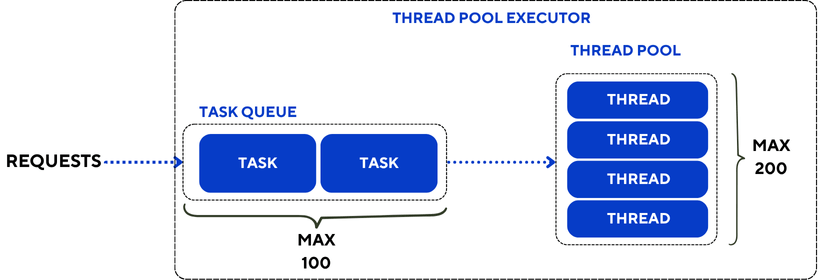
By default, when Tomcat starts, 10 threads are available and wait for the incoming traffic. As the number of parallel requests grows, Tomcat starts more threads until 200 threads are started. Then any request will wait for a thread to be freed.
Spring Web default timeouts
A web application may need to perform a call to an external REST API provided by another service. Spring provides two synchronous clients for REST calls: RestTemplate (deprecated) and its successor RestClient.
When performing a call to an external service, it is possible to configure two different timeout values:
- Connection timeout: it is the maximum time to establish the connection with the target host before sending any request.
- Request timeout (or Read timeout): it is the maximum time you can wait for a response to come back after you sent a request.
By default, Spring does not define any value for these timeouts, which means that each connection or request can wait for an unlimited amount of time. There are multiple reasons why waiting indefinitely is not good, but in the scope of our article, it is impacting our thread availability. The thread performing the call is waiting and cannot be released to process other incoming requests. If the number of blocked calls increases over time, the number of available threads decreases and the capacity of the application to serve requests concurrently decreases.
These kinds of thread leaks can be nasty because without the proper monitoring it is difficult to notice that one or several threads are lost and the throughput might decrease slowly without any explanation.
Fortunately, there is an easy fix without rearchitecting the application: never trust default values and always set values that make sense for your use case.
An example is worth a thousand words
To illustrate this, let’s build an application which provides two endpoints:
GET /bike:an API that returns a response after 5 secondsGET /bike/hanging: an API that calls an external service that never replies ❌
In scenario A, 200 clients call the /bike API in parallel and the test runs for 2 minutes. In theory, the server should be able to serve all these clients, the expected response time of the API is 5 seconds and the expected throughput is 40 requests per second.
The scenario B is the exact same test run but prior to starting these clients, the /bike/hanging API is called 60 times. As a consequence, 60 threads should hang indefinitely and only 140 threads remain available in the pool. The expected throughput should drop to 24 requests per second.

Results
Here is the outcome of the test for the /bike API:
| Scenario A (no hung thread) | Scenario B (60 hung threads) | |
| Number of calls in 120s | 4699 | 3380 |
| Average response time (s) | 5.00 | 6.99 |
| Max response time (s) | 5.10 | 12.06 |
| Throughput (req/s) | 37.6 | 26.7 |
The Scenario B shows 30% lower throughput and a 40% higher average response time compared to Scenario A. That is a very significant change in the performance efficiency of the application, only caused by 60 requests that failed.
Conclusion
In a real production environment, you may not get these exact 60 requests that get stuck infinitely. Usually there is more traffic than 60 requests and the thread pool gets exhausted quickly, which causes the application to hang, or there is a sneaky failure of “1 request once in a while” that causes a slight degradation in server performance. I personally encountered the latter, with 1 to 3 requests failing every week. Fortunately there was a second symptom to this thread leak that was caught by the monitoring and that will be the topic of the next article.

Leave a reply to How to get critical messages stuck in ActiveMQ – The Perf Parlor Cancel reply