
In a previous post, we detailed how the default Spring REST client configuration can generate a thread leak and how thread leaks impact the performance of the server.
In this post we will see that a thread leak can also affect the behaviour of your application.
I used to work for a company processing a lot of incoming data and our applications were using ActiveMQ. ActiveMQ is a publish/subscribe framework where publishers and consumers communicate asynchronously using a message queue. So we had data producers pushing their critical production data on ActiveMQ (location, alerts, etc.) and the data was consumed in real time by our servers.
The problem
Once in a while, the monitoring of the ActiveMQ queues showed that 1000, 2000 or 3000 messages were stuck in the queue and never consumed. No up-to-date location anymore, missed device alerts. We had to connect several times per week (including Sundays) and restart the consumers. Once the consumers were restarted the messages were processed quickly and the queue was quickly drained.
The culprit
What looked weird was that the number of stuck messages was always a multiple of 1000. After a deep dive in the ActiveMQ documentation, I found out that there is a parameter in ActiveMQ that has its default value matching this magic number:
Prefetch limit: maximum number of messages a consumer will buffer in memory before processing and acknowledging them
The ActiveMQ consumers use a polling process: each thread will poll a batch of messages (by default 1000) from the queue, and will process and acknowledge them. Once a thread polls messages from the queue, those messages are reserved for that thread and become unavailable to others until acknowledged. So if your original thread never acknowledges them, they are stuck forever.
In our case, the thread was initiating an HTTP connection to a REST endpoint. For unknown reasons, it happened that this connection never got established and because no timeout was set, the thread was hanging while trying to process the first message of the 1000 messages batch.
We solved it by setting timeout values so that the connection was closed and retried: the thread was not stuck anymore, the 1000 prefetched messages were processed, and the issue never reoccurred since.
Now you might not use ActiveMQ in your projects, but any framework that uses a batch polling mechanism that requires manual acknowledgement to release the messages from the queue are just as vulnerable to stuck threads. Fortunately, more modern Publish/Subscribe frameworks like Kafka or Google Pub/Sub have addressed this pitfall and the messages are available for other consumers if the original consumer does not acknowledge in a given time range.
Now let’s recreate this problem locally.
Demonstration
To demonstrate the issue, I spin up:
- An ActiveMQ Docker container
- A publisher pushing a high number of random messages in a queue
- A Spring boot consumer
For the publisher, I use JMeter’s JMS Publisher. Any tool would work, but I usually take Jmeter when I need to generate controlled load using parallel threads. I send 2000 messages on a queue of my local ActiveMQ:

I start a Spring boot application consuming from ActiveMQ using the spring-boot-starter-activemq. I configure 10 threads consuming in parallel using the spring.activemq.concurrency parameter but do not configure the prefetch limit. We will see what happens.
Last configuration: out of my 10 consumer threads, one will get stuck while consuming the first message by calling a REST endpoint that never replies.
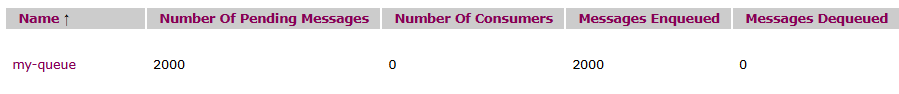
ActiveMQ provides a web administration interface and we can see there that I have 2000 messages in the queue before starting my consumer:
After starting the Spring boot application and waiting for the queue to decrease, the numbers stabilize at 767 pending messages. I restart the application and still have this magic number of 767 stuck messages.

If I capture a thread dump, I can see that I have 10 consumer threads, 9 being waiting in the “dequeue” method of the ActiveMQ client proving they are idle ready to consume, and the last one being the stuck thread blocked on the HTTP connection:

My hypothesis is that the default prefetch limit of ActiveMQ (1000) is actually overriden by Spring trying to be smart. My next step is to set the prefetch limit myself, it can easily be done by updating the broker-url to:
broker-url: tcp://localhost:61616?jms.prefetchPolicy.queuePrefetch=123
After restart, I can see some of the messages dequeued and 123 messages remaining stuck:

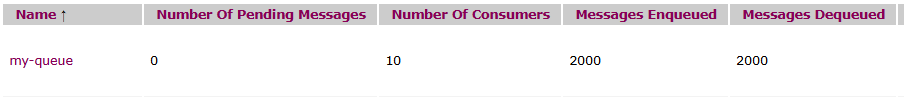
This demonstrates that the prefetch limit led to one single thread blocking all these messages forever. If I restart the application without the call to the REST API causing the issue, all messages are consumed successfully:
So what can we learn from this ActiveMQ example ?
The main takeaway is that performance issues can never be overlooked because they are closely tied to functionality. If your application does not have high loads to process, you may think that it is not worth fixing a single thread being stuck in a large thread pool. This example shows that a single thread stuck can lead to missing a critical alert in production.
It also highlights the importance of tuning and controlling the settings of your application. We will see in future articles the key settings of widely used frameworks and protocols when it comes to performance.

Leave a reply to Paul B Cancel reply